You pay for traffic, but most people never fill in the form or buy.
No idea why people drop off
Without heatmaps and funnel data, changes are guesses.
Forms and checkouts with friction
Long forms, unclear buttons and surprise costs push buyers away.
03 · Our Solution
How we solve it
Understand real behaviour
Heatmaps, click maps and funnels show where people click and leave.
Test every change
A/B tests prove which headline, button or layout wins.
Remove the friction
Shorter forms and smoother checkouts turn more visits into results.
04 · What's Included
Everything you get
Conversion audit and goal setting
Heatmaps, click maps and session recordings
Funnel and drop-off analysis
Landing page improvements
Form and checkout optimisation
CTA and headline A/B testing
Conversion tracking setup
Monthly testing report
05 · Visual Showcase
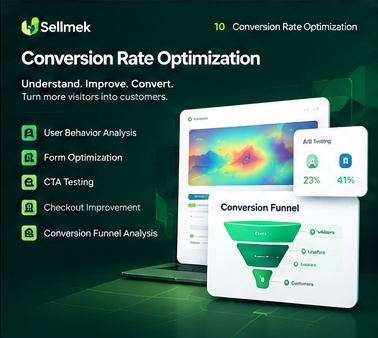
See where visitors click, and where they leave.
A landing page with heatmap and click map, a conversion funnel, a user journey that builds as you scroll, plus an A/B test and a before and after view you can try.
User behaviour
Watch what visitors really do.
Switch between the page, a heatmap and a click map. The funnel shows exactly where people drop off.
Landing page analysis
YourBrandProductPricingAboutSign up
Grow faster with less effort
One simple platform for planning, tracking and winning more customers.
Start free trialSee how it works
Fast setupReady in minutes
Clear reportsKnow what works
Friendly supportReal people
“We doubled our enquiries in two months.” — Happy customer
Conversion funnelLast 30 days
Illustrative sample data — your real heatmaps and funnels come from your own visitors.
Scroll to build
The user journey, layer by layer.
Keep scrolling — we map each step, find the friction and add the fix.
1Map the stagesArrive, scan, engage, decide and convert, each one measured.
2See what users doClicks, scrolls and form activity at every stage.
3Track confidenceThe curve shows where intent rises and where it drops.
4Find the frictionSlow pages, long forms and unclear buttons are flagged.
5Add the fixEach problem gets a tested change, and the curve recovers.
Interactive preview
Try an A/B test & a before and after.
Choose a change, run the test and see which version wins. Then drag the slider to compare a page before and after.
A/B test simulator
A · Original Winner
Get your free quoteTell us about your project.
Visitors0
Sales0
Rate0%
B · Variant Winner
Get your free quoteTell us about your project.
Visitors0
Sales0
Rate0%
Confidence0%
Press Run test to send visitors to both versions.
Before / after UI preview
Before
Learn moreDownloadContactSubmit
Submit
After
Get your free quote in 60 seconds
Tell us your email and we will do the rest.
you@company.com
Get my quote
★★★★★ Rated 4.9 by 1,200 customers
Conversion rate2.1%4.6%
Form completion31%68%
Bounce rate64%41%
Illustrative simulation — real tests need enough visitors to be reliable, and results differ for every site.
What we work on
Five parts of turning more visitors into customers.
User Behavior Analysis
Heatmaps, click maps and session recordings show what people notice, ignore and get stuck on.
HeatmapsClick mapsRecordings
Form Optimization
Fewer fields, clearer labels and helpful errors, so more people finish the forms that matter.
Fewer fields
CTA Testing
Button text, colour, size and placement tested against each other, so the winner is proven.
Get startedGet my free quote
Checkout Improvement
Fewer steps, trusted payment options and clear costs, so fewer baskets are abandoned.
CartDetailsPayDone
Conversion Funnel Analysis
We measure every step from first visit to purchase and fix the biggest drop-off first.
Biggest leak first
06 · Our Process
Discovery → Strategy → Design → Development → Launch
01
Discovery
we learn your business, audience and goals.
02
Strategy
we turn that into a focused plan.
03
Design
we shape the solution and you approve it.
04
Development
we build, test and refine.
05
Launch
we go live, hand over and keep improving.
07 · Case Study
Want to see similar work?
We share real project examples and results relevant to your industry during a call.