Website, ads, email and sales numbers live in separate tools, so nobody sees the full picture.
Numbers without answers
Charts show what happened, but not why or what to do next.
Reports that take too long
Hours of manual work every month, and the numbers are out of date when they arrive.
03 · Our Solution
How we solve it
One clear dashboard
Your key numbers connected and updated in one place.
Tracking you can trust
Conversion tracking and attribution set up correctly from the start.
Insights, not just charts
Reports that explain what changed and recommend what to do next.
04 · What's Included
Everything you get
Tracking audit and measurement plan
Analytics and conversion tracking setup
Custom KPI dashboards
Traffic and audience analysis
Campaign attribution reporting
Scheduled monthly reports
Data-driven insights and recommendations
Training for your team
05 · Visual Showcase
See your numbers the way you will.
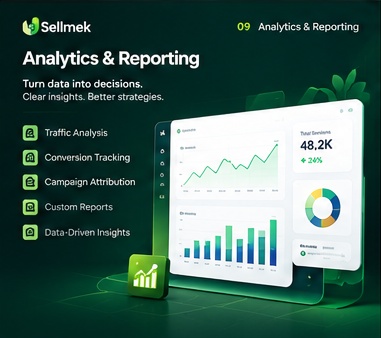
A live analytics dashboard with interactive charts and KPI cards, a performance report, data layers that build as you scroll, and a date filter and comparison you can play with.
Analytics dashboard
All your key numbers, in one place.
KPI cards, an interactive trend chart and traffic sources. Hover or tap the chart to read any day.
Website analyticsLive · last 30 days
Sessions over time
This periodPrevious period
Traffic sources
Organic38%
Paid24%
Social14%
Email10%
Direct14%
Conversion rate by channel
Monthly performance report
October results
Prepared for Your Brand
Summary
Sessions grew 18% and conversions 24% against last month.
Organic search is now the largest source of leads.
Weekly sessions
Channel
Leads
Change
Organic
412
+22%
Paid
268
+9%
Email
131
+31%
Insight: email brings the cheapest leads. We recommend sending one more campaign a month.
Illustrative sample data — your real dashboard connects to your own analytics, ads and CRM.
Scroll to build
From raw data to a clear answer.
Keep scrolling — a chart builds up layer by layer, from scattered data points to an insight you can act on.
1Collect the dataEvery visit, click and sale is captured from your site, ads and CRM.
2Give it structureClean, organised data on clear axes: time, channel and metric.
3Reveal the trendNoise is smoothed so the real direction is visible.
4Set the targetGoals are drawn on the chart so progress is clear.
5Explain what it meansA plain-language insight tells you what to do next.
Interactive preview
Try the date filter & metric comparison.
Pick a date range and a metric, then compare it with the previous period.
Total0
Previous period0
Best point0
Illustrative sample data — your real reports use your own tracked numbers.
What we work on
Five parts of reporting that drives decisions.
Traffic Analysis
See who visits, where they come from and what they do, so you know which channels and pages matter.
Visitors
Conversion Tracking
Forms, calls, purchases and sign-ups tracked from the first click to the final result.
VisitLeadSale
Campaign Attribution
Know which ads, emails and posts earned the credit, so you put budget where it works.
First touchMulti-touchLast touch
Custom Reports
Dashboards and reports built around your goals, delivered on a schedule in a format your team can read.
WeeklyMonthlyBoard pack
Data-Driven Insights
Plain-language findings and clear next steps, not just charts, so every report ends with an action.
What happenedWhyWhat next
06 · Our Process
Discovery → Strategy → Design → Development → Launch
01
Discovery
we learn your business, audience and goals.
02
Strategy
we turn that into a focused plan.
03
Design
we shape the solution and you approve it.
04
Development
we build, test and refine.
05
Launch
we go live, hand over and keep improving.
07 · Case Study
Want to see similar work?
We share real project examples and results relevant to your industry during a call.